Looking at chart 1 you can see that 59,3% of the Maine Coons that were tested within the health program over the total period, have normal hips. For a British shorthair or longhair this is much lower at 39,4%, showing that this breed has a high risk of HD. The total bar at the right is mostly based on the large number of Maine Coons, since 93% of these results are Maine Coons. The British short/longhair brings the percentages slightly down and then there are just a few results from other breeds. Don’t make the mistake to use the «Other breeds» bar to conclude that HD is not a problem in all other breeds. As for most breeds we simply don’t have any data. The 25 test results that are in this bar are scattered into 14 different breeds, which doesn’t tell you anything. Also note that the data for Persians & Exotics, Devon Rex, Siberian and Norwegian Forest cat is too little to get a good overall picture of the breed. Yet when you look at the OFA statistics for the Persian & Exotic and Devon Rex they show the same concerning figures. This could be a warning sign and it would be a good idea to test these breeds more often to see where it stands exactly.
PawPeds recommends to exclude cats from breeding programs that have moderate or severe HD (grade 2 or 3) for at least one hip. For the total tested population this means that 16,9% is recommended not to breed with. It is not recommended to breed with 16,1% of the HD tested Maine Coons and 31,9% of the British short/longhair (almost twice as much).
The rest of this analysis is only about the Maine Coon test results, because the amount of data is big enough to zoom in further to see trends and look for potential correlations.
HD development per year (Maine Coon)
In chart 1 you saw the total HD results of the Maine Coon breed (fourth bar). Now let’s spread this out further and break it up into each year. The white dotted line shows the amount of HD results for that year. The years before 2000 were left out because they had too little results. The year 2008 has the most HD evaluations done throughout the whole HD health program.

You can see that the current situation is much worse than the total showed in chart 1. In 2019 only around 40% of the evaluated MCO’s have normal hips. This current situation for the MCO is very close to the British Shorthair/Longhair bar at chart 1. The trend seems to be a downward trend, where the chances for normal hips took a fall of almost 30% since 2014. The grade 2 and 3 trend is also downward but less steep than the grade 1 and normal results.

In chart 3 you can see for each year how many of the HD tested cats had either grade 2 or grade 3 and were therefore not recommended for breeding. You can see that this trend started to go upward from 2012. It had some more or less «good years» like 2014 and 2018 where «only» 16% of the cats have a serious form of hip dysplasia. When the HD program started, the impact of the breeding recommendations suggests to exclude 12% of the population from breeding. In 2019 this doubled up to 25% of the population. (2020 seems promising, but we only have results until July 12, effectively until May 12 if you consider the 60 days waiting time before publication.)
So the big question is: Why does HD seem to be more of a problem over the past 7-8 years?
Possible explanations:
-
The bigger the better? Many breeders seem to select for bigger size and heavier cats. Also overfeeding kittens making them put much weight on as fast as possible, could have a negative impact on the hip joints. A study of 2019 showed a direct correlation between weight and HD. Bigger and heavier cats have a higher risk of HD.
-
The popularity of the Maine Coon has exploded around 2015, which has attracted many new kitten mills and back yard breeders all over the world who care little about the health or protection of the breed but instead try to breed for bigger sales. Breeding for size, using high inbreeding and overused lines with no (or little) HD testing done at the cat or the ancestors. Of course also there are new good breeders as well, but this is the minority and also they produce far less than the big kitten mills.
-
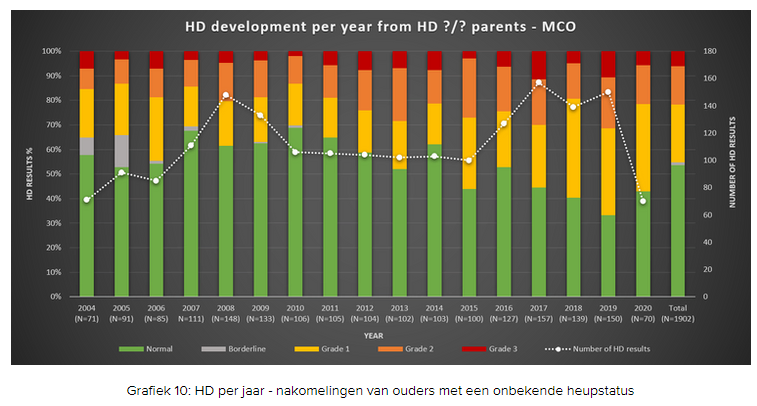
Many untested lines were introduced into the health program with an unknown hip status of the parents or grandparents. Although it is a good thing that more lines are being tested on HD, these cats will have a higher risk of HD and their results will have a negative effect on the average. Sweden has made the biggest contribution to the HD program. Since 2012 the rules for importing cats into Sweden have become less strict, which had an increasing effect on the number of imported cats. Also importing from East European countries has become booming since 2015. These lines have a poor HD test record and breeders of those countries don’t participate at the HD health program at all (or at this point not yet). In chart 10 you can see that the amount of HD tested cats with unknown hip status of the parents has climbed enormously starting 2016.
-
Most MCO breeders work with 70% of the same gene pool. The top 5 most common ancestors consist of 70% of the genetic foundation for the average Maine Coon. If some of the foundation stock has HD, it is hard to get rid of, especially when we only do matings with cats that have the same genetic foundation (except for New Foundation lines).
-
In 2014 the status Borderline was deleted as a possible result. Also the PawPeds specialist that did the hip evaluation has changed from Lars Audell to Per Eksell in 2014. It could be that a part of the grade 1 results could have been given Borderline if that was still an option. Also it could be that Per Eksell was slightly more strict in his evaluation than Lars Audell, showing worse results since 2014.
Difference in gender
Between females and males there is a slight difference in chances for bad hips. Females have 15,4% chance of grade 2 or 3 compared to males who have 17,3% chance of grade 2 or 3.
Chart 4 shows the totals of the whole health program over the whole active period in time.
Since the genders seems to have the highest difference in the grade 2 and 3 area, I’ve made another chart that breaks down the grade 2 + 3 development over the years, for males and females separately. See chart 5 below.


Chart 5 is similar as chart 3, with the addition that you can see the difference in gender now. In chart 5 you can see how many of the tested females/males received a grade 2 or 3 result each year. There are far more females tested for HD than males, but the charts shows the percentage relatively to the total per gender. By showing the relative percentages, this will allow you to compare the development of HD problems over the years divided by gender. You can see that in the beginning of this century, HD occurred more in the female population. This trend took a turn in 2008, a starting point where the males have substantially more HD cases than the females. From 2017 both genders seem to score about the same.
Difference in age
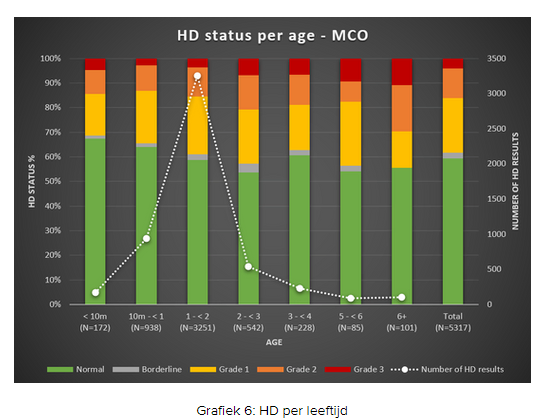
Now the next chart shows the difference in age. PawPeds gives a preliminary result before the age of 10 months, which you can view at the first bar in chart 6. You can see that bad hips (grade 2 + 3) are already shown at a very early age. Some breeders believe that a cat should be better off tested at age 4, as they think the Maine Coon is still growing until it reaches 4 years of age. In chart 5 it shows that cats that the amount of cats with normal hips are about the same when you compare the cats that were tested at age 1 – 2 with age 3 – 4.

So what does this chart say? My interpretation is that this chart shows that HD is for the most part a genetic issue, since you can already see serious HD at a kitten younger than 10 months. When you look at the official results (>10 months) a consistent trend is visible with a variation between 1-11% per result for the different ages. But if it was ONLY a genetic issue, the cat with normal hips at a young age, should still have normal hips at a later age. You see the amount of cats with normal hips is around 10% less with the older cats. Their increased weight or fast growth could explain the difference. Environmental issues like slippery floors, accidents, low quality food or heavy pregnancies could also be of influence here.
You can also see that the amount of grade 3 affected cats is around 3-4 times higher at an older age. Arthritis can damage the hip joint further when time passes, which can worsen the hip status into a higher grade when the cat ages.
Difference per country

This charts shows the tested cats per country, where I took the country of residence (not birth). Let us first notice that 48,1% of all HD test results are from Sweden. Sweden and the Swedish breeding program therefore has a major impact on the development of the HD health program and on the result of this analysis. France has the most cats who got a grade 3 result (relatively to their tested cats). New Zealand scores the best at normal hips and Norway the lowest. Denmark has relatively the least cats with grade 2 and 3 results. Overall there are no major differences noticeable. What stands out very clearly is that countries who participate very little at the HD health program, show the worst HD results (see the bar: Other countries, 3,5%).

Chart 8 is the same chart as number 7, with focus only on the grade 2 and 3 results, to compare them better per country. The percentage next to the country shows, how many of the HD tested cats are living in that country. It would be interesting to know if there are differences between countries that can have an influence on the hips of their cats (raising kittens, environment, food).
Inheritance of HD in two generations
Now we get to another interesting part. The part of genetics and inheritance. From looking at the trends above you might start to wonder if we can really prevent HD? Let’s look at how breeders mating choices can affect the hips of the offspring. Let’s look at two generations, the parents and their offspring, and how the hip status of the parents passed through the next generation.

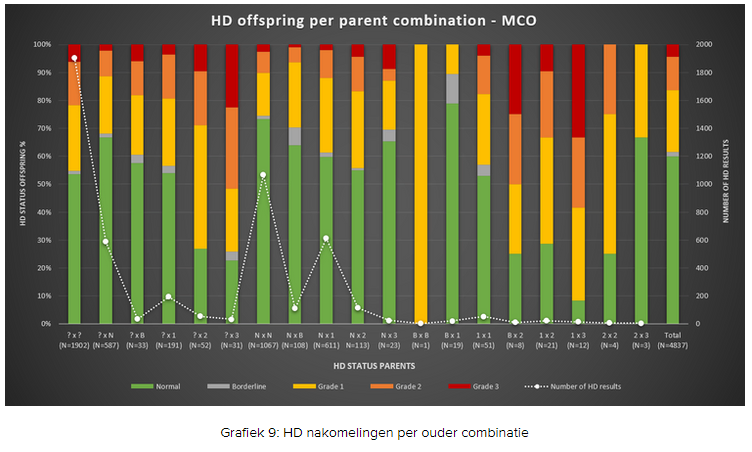
In Chart 9 you see different parent combinations for each bar in the chart. The first bar shows the offspring of parents with an unknown hip status. Around 54% of their offspring has normal hips. The second bar shows offspring of a parent combination where 1 parent has normal hips and the other parent has an unknown hip status. You see that with 1 parent with normal hips, the chances for offspring with normal hips has increased to 68%. When you look at bar 7 that shows the offspring of parents that both have normal hips, you see another big jump to 74% chances of offspring with normal hips. Now you know how to read the rest of the chart. The white dotted line indicates how many offspring was tested for each parent combination. This number is also written below each bar (N=…). Some of the parent combinations that are not recommended by the PawPeds health program (like grade 1 x grade 3) obviously has very few data. There are not a lot of breeders who do these risky matings. Those bars are therefore less reliable, but still can give some indication why those matings are not recommended.
When you study chart 9 you can conclude that a breeder can lower the risk of HD enormously in the offspring, by choosing the right matings. At the same time you can also see that HD cannot be totally prevented. Even with HD N/N matings, there is still a slight change of 2,5% that the offspring will get HD grade 3.

Now in chart 10 I have zoomed into the first bar of chart 9, the 1902 HD result from parents with an unknown hip status. Here in chart 10 you can view just those 1902 results, divided by year, so you can see the development of HD. I’d like to think of this chart as the closest chart to the reality of the whole Maine Coon breed, since these are a collection of cats that with unknown hip status of the parents. For a closer reality you might have to look at more generations, but still this one can give a good indication. For as the far majority of the breed has an unknown hip status, since only a little percentage of the breeders test on HD.
What stands out is the downward trend. When you look at the total bar on the right, you see a kind of optimistic picture, as this is the average from all these years. Unfortunately the reality nowadays is much worse, as you can see from the downward trend. From 2004 until 2014 there was a 50-70% chance of normal hips when you don’t know the HD results of the parents. From 2015 until 2020 we see that same chance has dropped to 32-52%. Chances for normal hips are quite less nowadays when you want to test a new line for HD within the health program. When you test a cat for HD within PawPeds nowadays, you would have around 30% chance of moderately to severely affected hips. Theoretically this is at least one kitten at each litter where the parents are not tested for HD, which is a very serious problem!

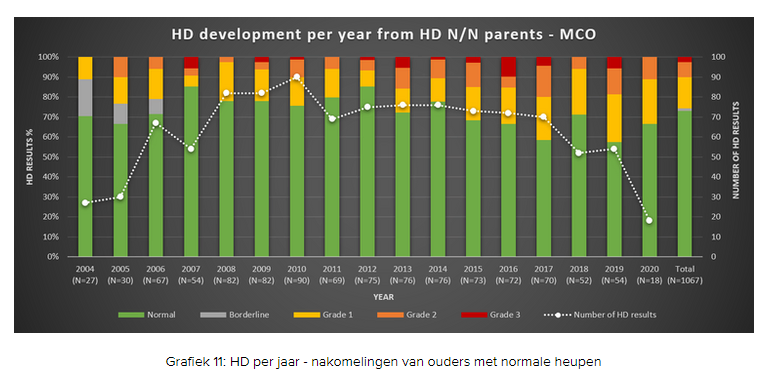
In chart 11 I’ve zoomed into the 1067 test results that are from offspring from parents who both have normal hips on both sides (bar nr 7 at chart 9). These are from breeders that are testing at least two generations. This is still the very best scenario, compared to all other parent combinations. Here is also a downward trend visible, less steep than in chart 10, but still very visible. However, when you compare chart 11 to chart 10 it shows very clearly what a positive impact HD N/N parents can have on their offspring. Also you can see from the white dotted line that the number of N/N x N/N combinations has reduced in 2018 and 2019 which is concerning.
Conclusion
We can clearly see from this analysis that inheritance plays a big part in developing HD. It shows that breeders can influence the HD results within the breed. HD can’t be totally prevented, but it can be reduced. Nevertheless we don’t see any improvement over the years, on the contrary, the trend is downwards. This means a strong call for action, we need to be aware of this problem and try to reverse it, before the problem becomes any bigger. If breeders do not volunteer to test on HD, the problem will become so widespread in the breed, leaving the associations no choice but to make the test mandatory. FIFe has attempted to make HD a mandatory test in 2019, but it has been hold of for now. With certain dog breeds the HD problems are very large for a long time, which has lead them to mandatory HD tests in order to apply for a pedigree. I hope the Maine Coon breeders don’t let it come to that point and will use their current freedom to do what is responsible.
Discussion for MCO breeders
The last few years showed us that we needed to exclude 20-25% of the tested MCO from our breeding stock, if we follow the recommendations of the PawPeds HD health program. Can we afford ourselves to exclude so many cats, especially when they have a well tested background, from valuable lines and with a high genetic diversity? On the other hand, if we loosen up the current breeding recommendations, how would we be able to turn the tide for HD if we are adding more HD to it? This sword cuts both ways and this needs to be discussed and carefully dealt with.
Can we derive conclusions from this analysis about how healthy a breed is in terms of HD?This analysis can not be used to derive any statement about breed predisposition. The health database is used mostly by breeders who keep track of HD in their healthy breeding cats. This population only consists of the cats that are tested within the PawPeds HD health program. From these tested cats we get an honest picture, because the breeders signs for publication before the HD picture is taken and evaluated by PawPeds. Which makes it harder to cheat or to withhold bad results. The population used for this analysis only consist of pedigreed cats. We don’t know if the same figures apply for none-pedigreed cats, or pedigreed cats that are not tested within the health program. My guess would be that the number of HD grade 2 or 3 diagnosed cats are higher in none pedigreed cats or within untested lines, simply because these lines are unknown and therefore their HD status is unknown. There are very few breeders of none-pedigreed cats who test the parents on HD before having a litter (I haven’t met one yet). In chart 9 you can see that HD tested cats from parents with an unknown hip status, have more chances on HD then tested parents.
With all of this taken into consideration while looking at the charts, the breed as a whole could show a worse picture then the one I presented to you in this article.
To be continued…
In part 2 of the HD analysis I will look more into detail at the inheritance of multiple generations. This I will do in cooperation with other breeders, as this is too much work for me to do by myself. Also we will look and see if there is a correlation between inbreeding levels and HD and if the clones can have an impact on HD. We might find some other interesting factors too. When you have a suggestion or a lead where to look for, don’t hesitate to contact me. Also if you want to help with the next part, so we can publish it sooner, let me know.
This article is written and owned by:
Debbie Sprenger – Cattery Macadamia
© 2021 Berkano Cattery -All material on this site is copyrighthed and many not be printed or reproduced, in any form,without the express writen consent of Berkano Cattery.
Página desarrollada con ❤ por Cattery Web.
